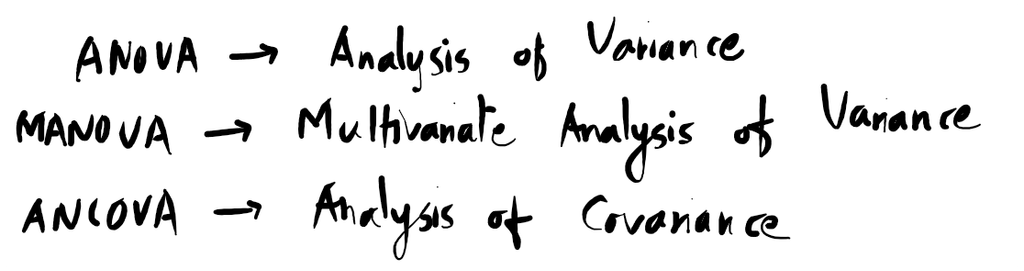
ANOVA is a statistical method used to analyze the differences between groups. There are other different types such as MANOVA and ANCOVA as well.
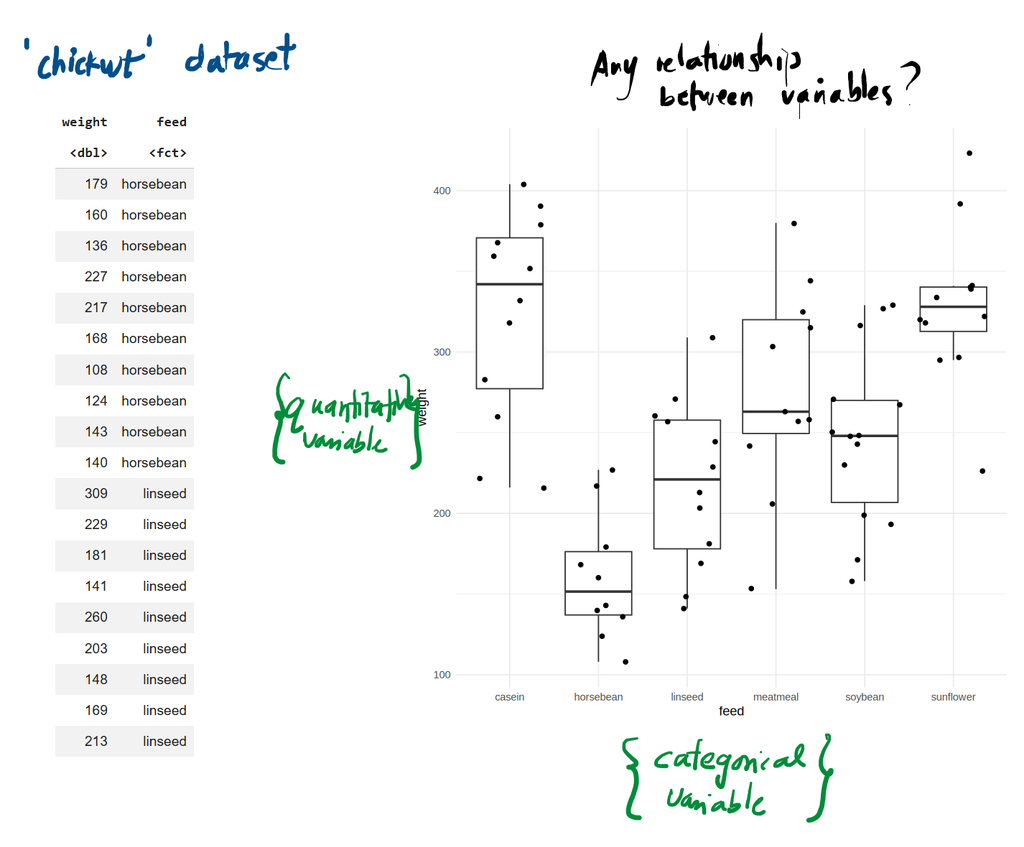
For example, let’s consider a dataset Chickwt in R. If we plot, we can something like below using ggplot(chickwts, aes(x = feed, y = weight)) + geom_boxplot(outlier.shape = NA) + geom_jitter() + theme_minimal() [From 6].
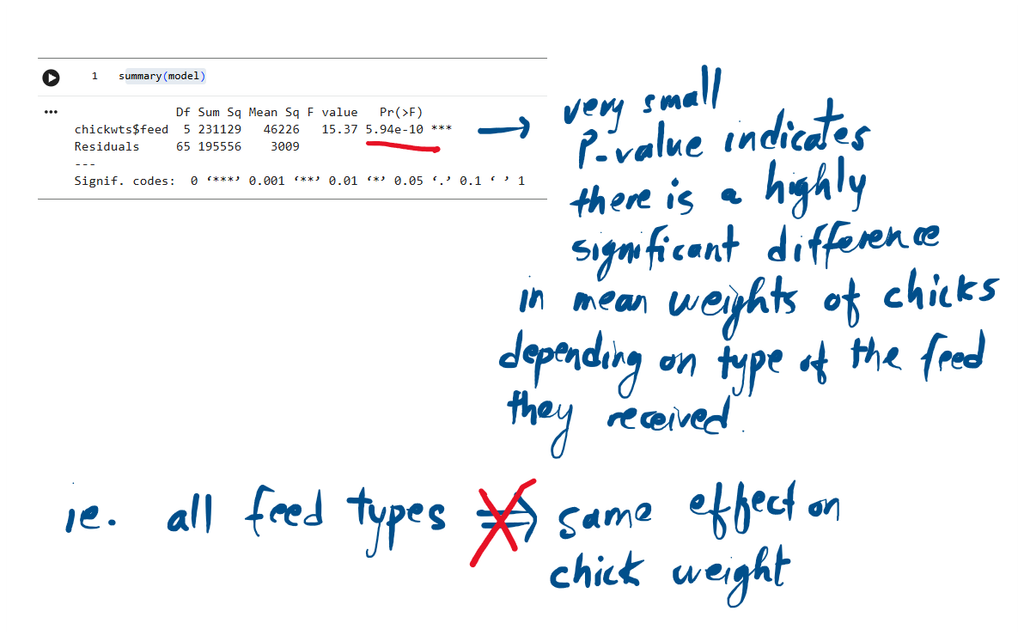
We can use AOV from R as: aov(chickwts$weight ~ chickwts$feed) from which we get:
Full code: https://github.com/computingnotes/ANOVA-in-R/blob/main/ANOVA_in_R.ipynb
References:
1. Gaddis ML. Statistical methodology: IV. Analysis of variance, analysis of covariance, and multivariate analysis of variance. Acad Emerg Med. 1998 Mar;5(3):258-65. doi: 10.1111/j.1553-2712.1998.tb02624.x. PMID: 9523936.
2. M. Schweinberger, “ANOVA, MANOVA, and ANCOVA using R,” LADAL, Mar. 27, 2026. https://ladal.edu.au/tutorials/anova/anova.html
3. “8 Multivariate Analysis of Variance (MANOVA) – STAT 505 | Applied Multivariate Statistical Analysis,” Psu.edu, 2026. https://online.stat.psu.edu/stat505/Lesson08
4. “ANOVA in R,” Stats and R, 2020. https://statsandr.com/blog/anova-in-r/
5. “Variance – Wikipedia,” Wikipedia.org, 2026. https://en.wikipedia.org/wiki/Variance
6. Youtube.com, 2026. https://www.youtube.com/watch?v=GokvYQiGdm0